

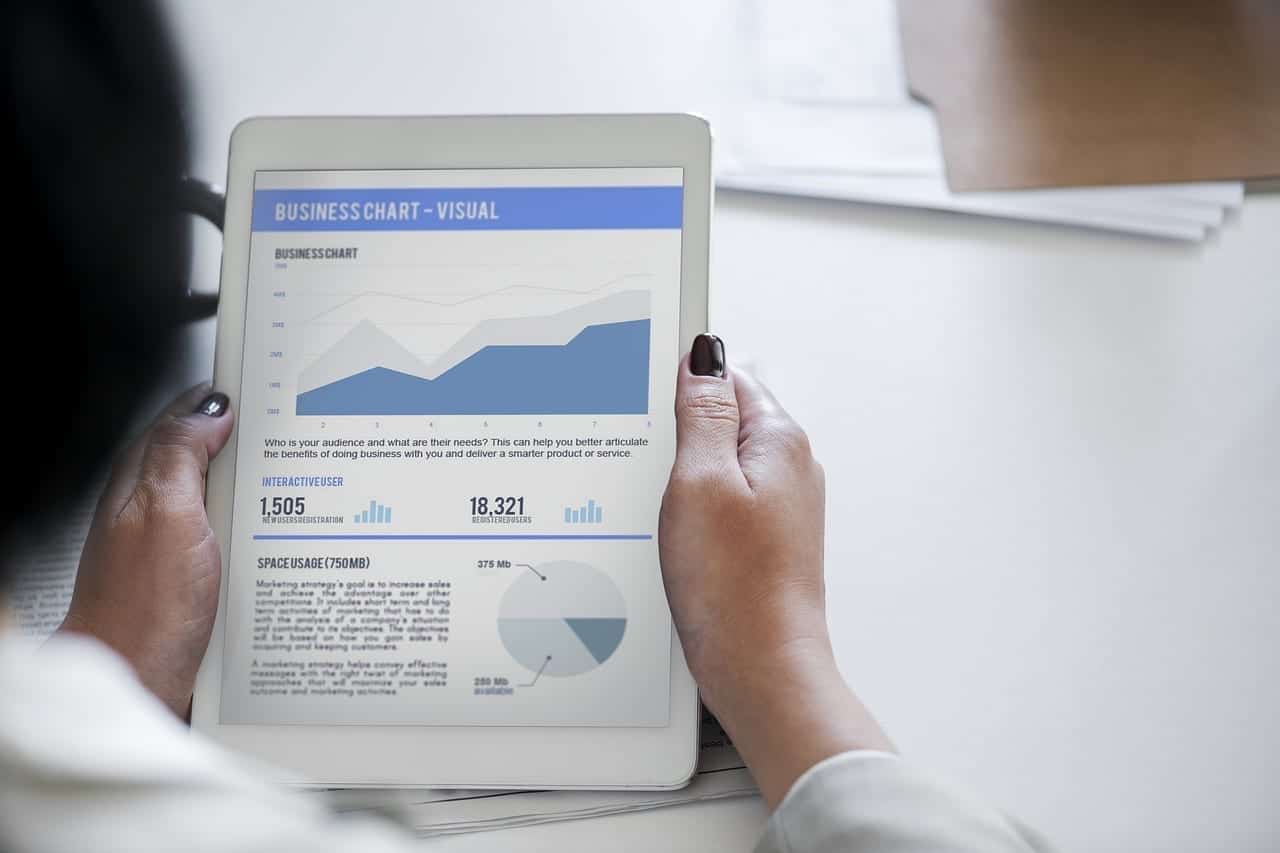
Ninety percent of the data in the world was created in the last two years. What?!? Without context, data is just a lot of information that’s hard to understand. Data visualization can be used to simplify complex topics or subjects, enabling us to grasp information quickly. Reading a spreadsheet can be boring and difficult, but translating that information to a chart make sit easier to understand. We’d argue that watching an animation that clearly explains the impact of all the numbers in a video is the pinnacle of data visualization.
What is Data Visualization?
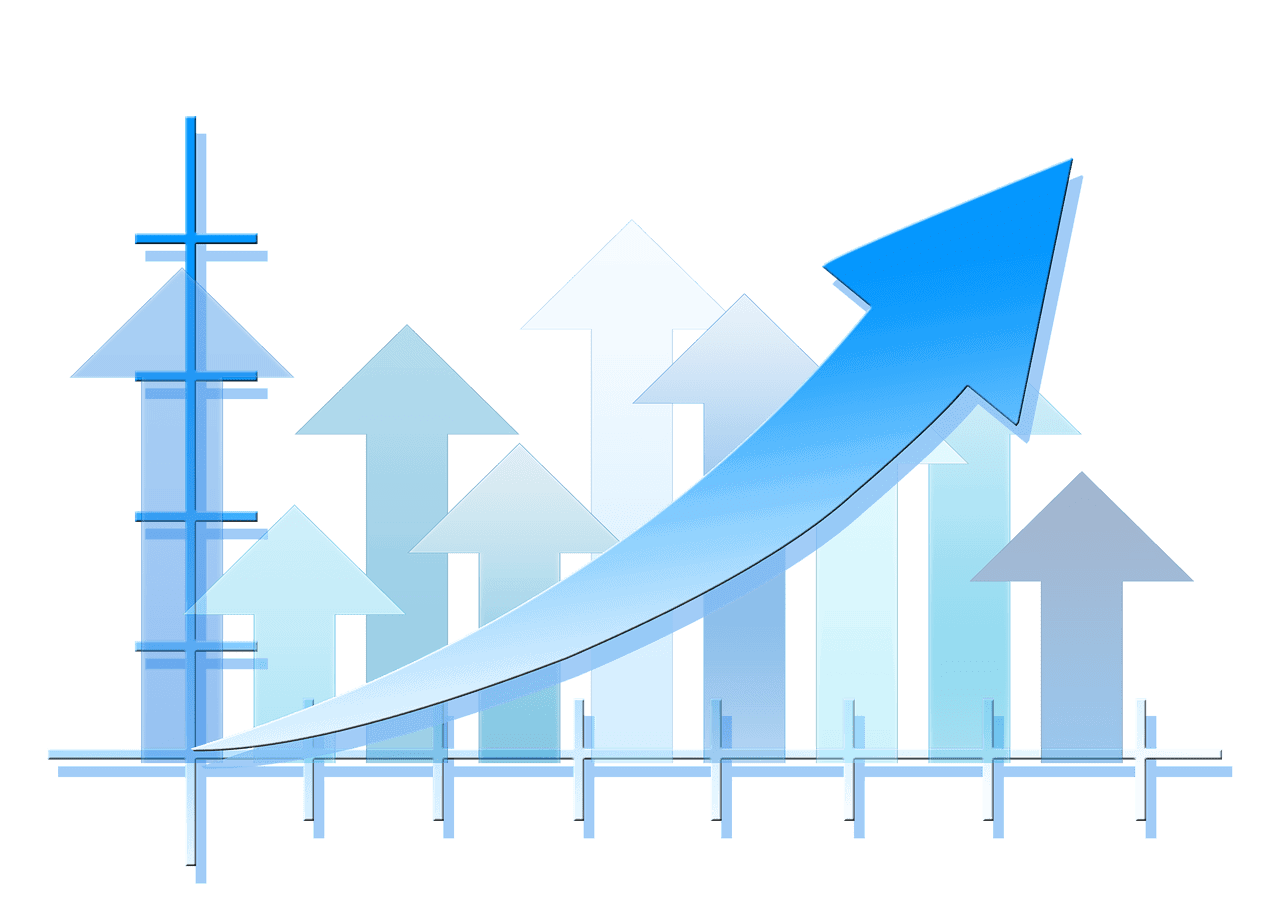
Data visualization is anything that transforms numbers into a format that tells the story behind the data. Common forms include statistical graphics, plots, and infographics. This numerical interpretation makes patterns, trends, and correlations come to light. For example, an upward trend of sunscreen sales in June could be clearly reflected in a chart that isolates that product from all the monthly sales in a drug store.
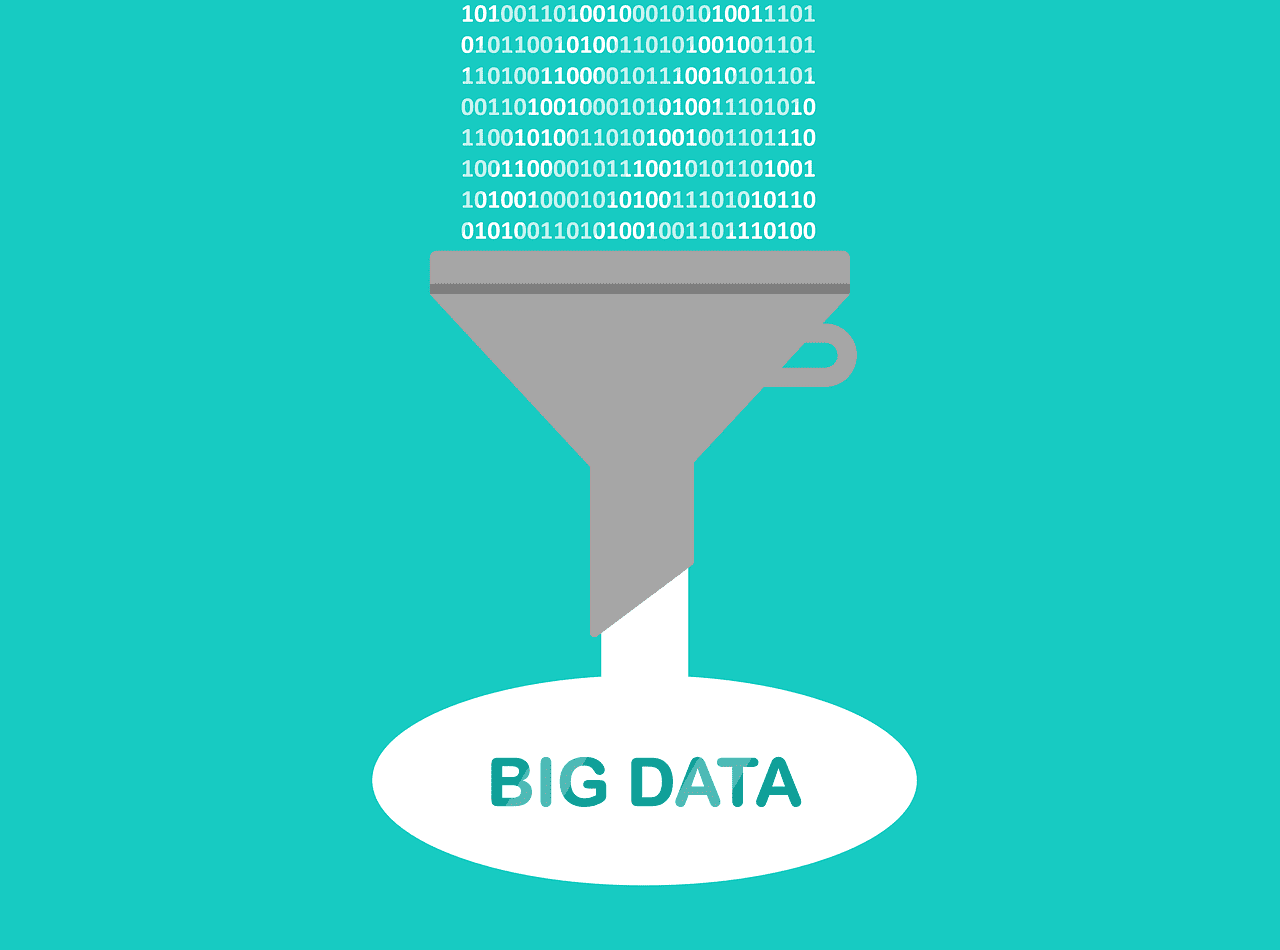
Big Data
The term “big data” refers to extremely large sets of data that can be used to create data visualization. Taking these vast amounts of information and analyzing them is what leads to the recognition of trends, patterns, and associations. Here are a few stats to give you a better idea of just how much data is out there:
- Google processes over 40,000 search query every second on average = 3.5B searches daily
- Facebook users send an average of 31.25M messages every minute
- 249 billion emails are sent daily
- more than 230 million tweets daily
- Globally, the number of smartphone users will grow to 6.1 billion by 2020
Data Visualization and Video are a Perfect Match
Corporate video is a great place to use data visualization. In our industry, we’re already working in a visual format. Plus, we have the added advantages of moving graphics (animation) and narration (voice-over). From a set of numbers, we can clearly show and explain how data affects your business. We can also use this information to illustrate product or service benefits to your customers.
Our clients often want to translate vast numbers into meaningful insights. Think about the information that you remember—Is it easier to recall a history class? Or the movie you saw about the Battle of Vimy Ridge? Or the historical fiction you read on the topic? Making numbers relatable makes them memorable. That’s where infographics come in. Based on the look and bent of your video, we can match infographics to the rest of the project, making data an integral part of what makes your video successful.
Why Data Visualization Works
People like to see data visualization because numbers are related to facts, which increase believability, which builds trust. Our brains process visual data much more easily than poring over reports and spreadsheets. Data visualization is a quick, easy way to convey concepts in a universal manner. Even without sound, data visualization can make a point.
In a corporate setting, data visualization is a valuable explainer tool. It can be used to identify areas that need attention or improvement, show patterns in customer behavior, and predict sales. A long report full of numbers isn’t particularly engaging. Translating those numbers into animation is storytelling. Think of data visualization as the movie version of a book or snapshots of your business. Incorporating data visualization in a corporate video that’s largely data-dependent is a great way to make sure your big data has a big impact.
Numbers Made Easy
At Key West Video, we know how to create the data visualization that gets noticed. Talk to one of our producers about the best way to represent your data with video. Call us today for a free quote.